
- Solutions
Solutions
Digital systems for Ex compliance and inspection control
SafeEx Cloud
Ex inspection and maintenance system
RFID Tags
ATEX and IECEx asset identification
Intrinsically Safe Devices
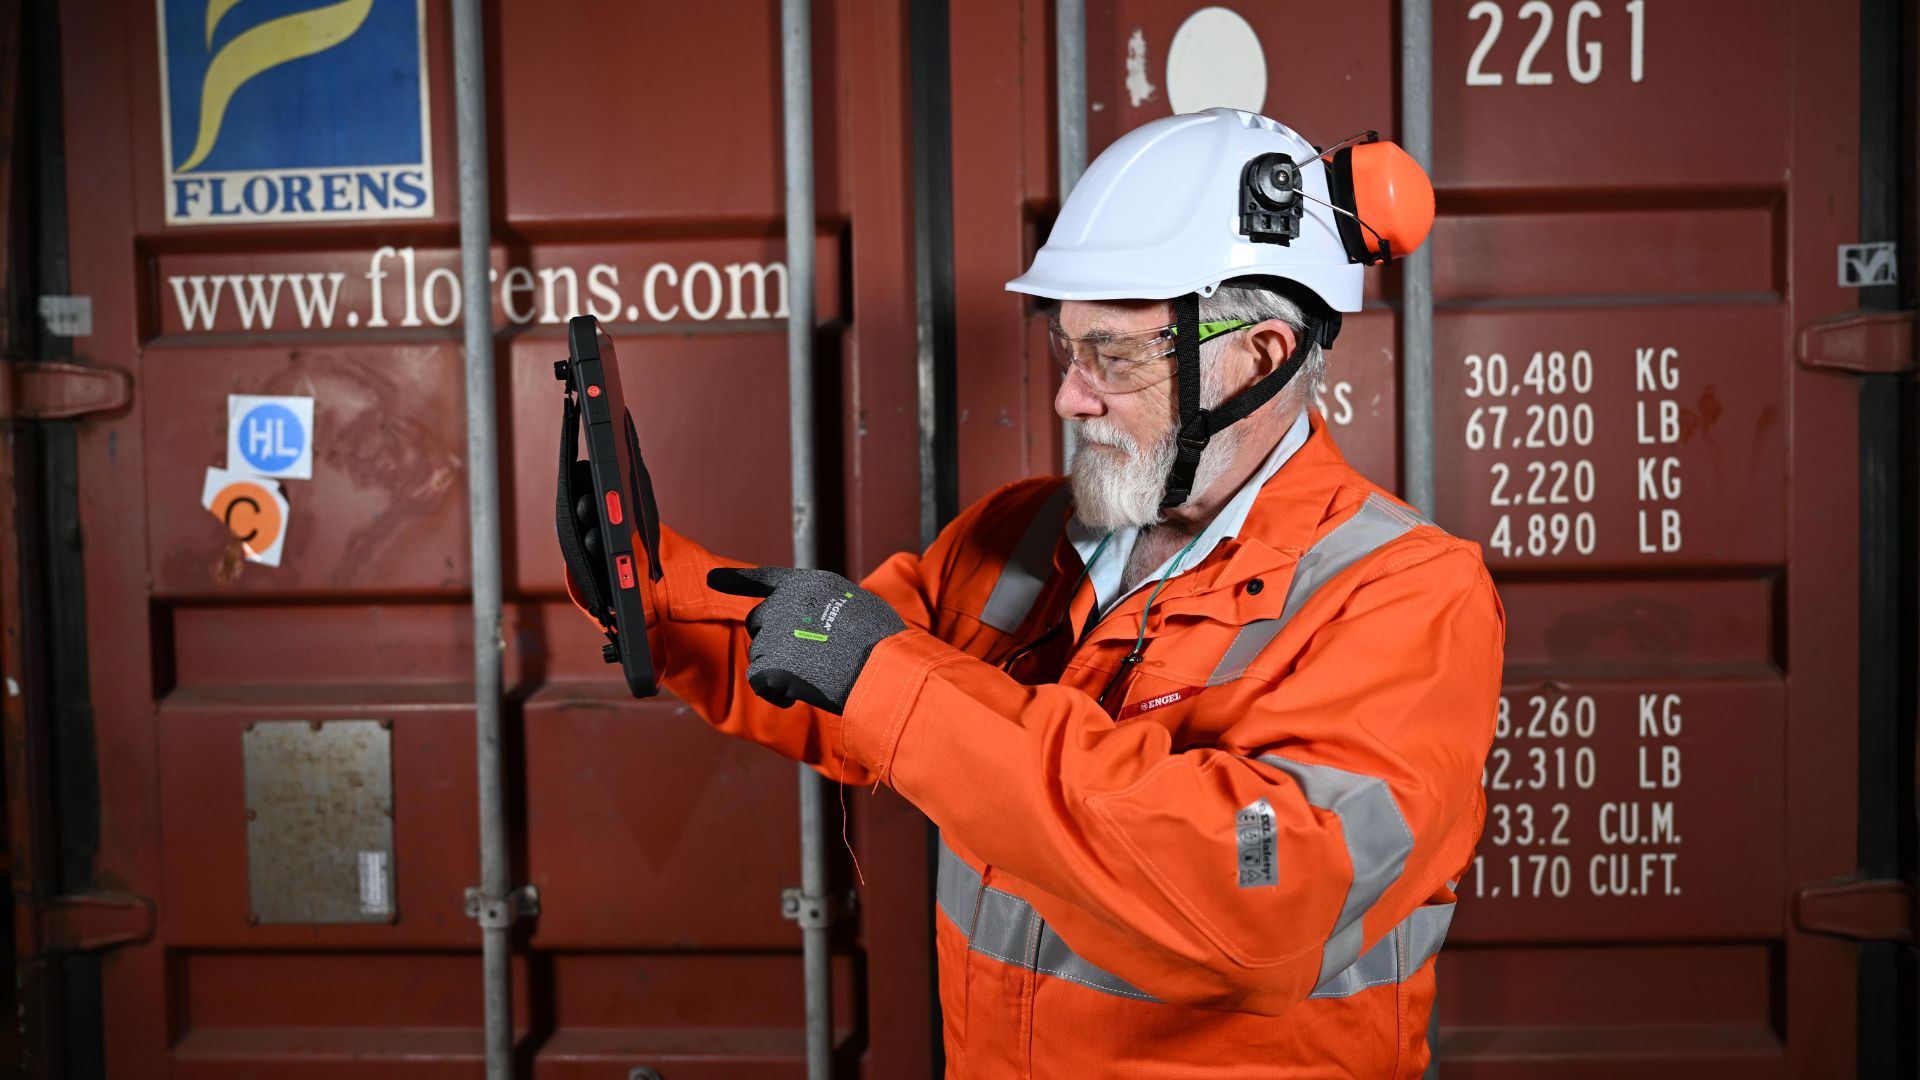
Ex certified tablets and smartphones
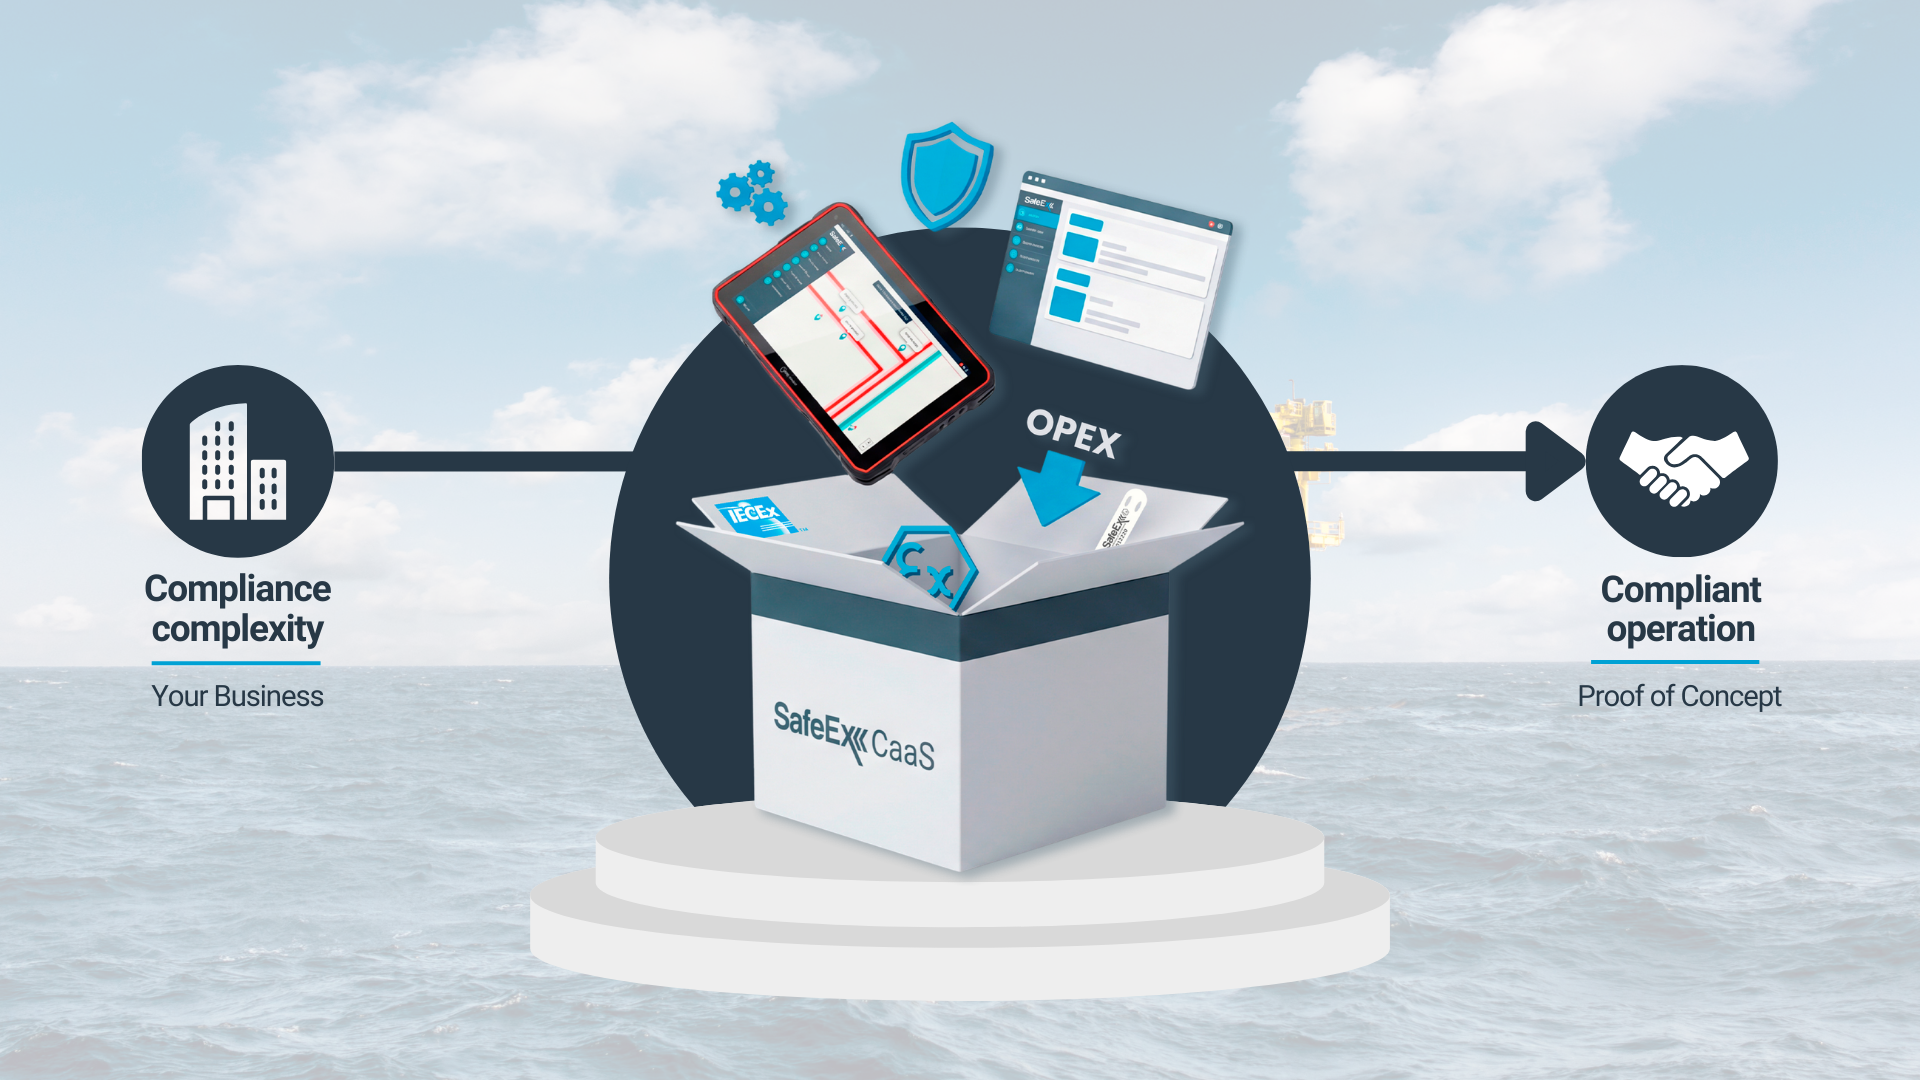
SafeEx CaaS
Fully managed Ex compliance setup
- Professional Services
Professional Services
Expert support to ensure correct setup, execution, and long-term compliance
Onboarding
System setup and configuration
Training
Role-based user training
Inspectors & Supervisors
Certified Ex specialists
Remote Supervision
Off-site Ex inspection validation
- Resources
Knowledge Center
Knowledge, documentation, and proof from real Ex operations
Case Studies
Results from real projects
Blog
Insights and updates
Resources
Whitepapers, guides & datasheets
- About Us
Company
Who we are and the expertise behind SafeEx
About SafeEx
Company and mission
Partners & Agents
Global network
Careers
Join our team